Create a CPI History Table
This example loads a complete CPI series and inserts the historical observations into a structured Excel table.
Use this approach when you want the CPI history available directly in your workbook for analysis, charts, formulas, or reference.
Example
We will insert the Canadian All-Items CPI history.
At the top of the finPack task pane:
- Select Canada as the country.
- Select All-Items as the CPI series.
- Select Load CPI Data.
finPack loads the available CPI history and displays the series preview.
Review the series preview
Before inserting the data, review the information shown in the preview.
The preview includes:
- Region and series.
- Latest available period.
- Latest CPI value.
- CPI Increase.
- Number of observations.
- Data source.
For example:
Region / Series  Canada / All-Items
Latest           2026-09
Value            170.0
CPI Increase     3.1%
Observations     321
Source           Staitstics Canada WDS
The number of observations depends on the historical data available for the selected series.
Insert the CPI history
Select Insert Series into Excel.
finPack creates a new worksheet and inserts the CPI history into a structured Excel table.
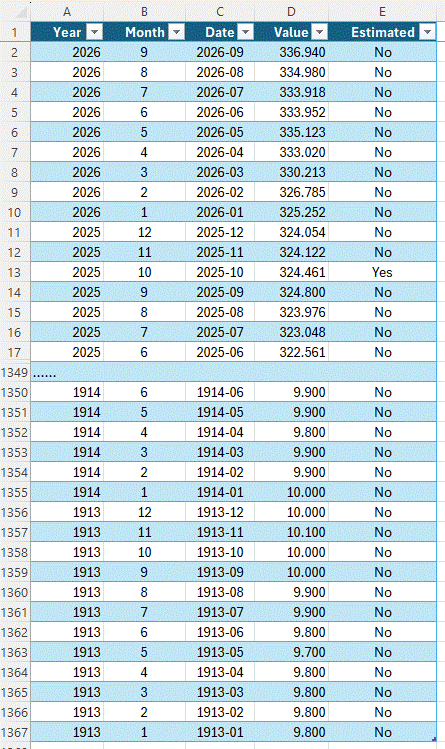
Table structure
The table contains five columns:
| Column | Description |
|---|---|
| Year | Year of the CPI observation. |
| Month | Month number of the CPI observation. |
| Date | CPI period in YYYY-MM format. |
| Value | Numeric CPI value, displayed using the precision configured for the selected CPI series. |
| Estimated | Indicates whether the observation is estimated. |
For example:
| Year | Month | Date | Value | Estimated |
|---|---|---|---|---|
| 2026 | 9 | 2026-09 | 170.0 | No |
| 2026 | 8 | 2026-08 | 169.8 | No |
| 2026 | 7 | 2026-07 | 169.9 | No |
The newest observations appear first.
Excel table features
finPack inserts the historical observations as an Excel table rather than as an unstructured range.
This provides standard Excel table capabilities such as filtering.
finPack also freezes the header row so that the column headings remain visible while scrolling through the CPI history.
Microsoft Excel's worksheet API supports freezing worksheet rows in place. Microsoft Excel freeze panes documentation
CPI value formatting
CPI values are stored as numeric values.
When finPack inserts a complete CPI series into Excel, the Value column is formatted using the maximum decimal precision configured for that CPI series.
For example, a series whose maximum configured precision is one decimal place displays values such as:
170.0
A series whose maximum configured precision is three decimal place displays values such as:
336.940
201.800
Because the values remain numeric, they can still be used in Excel formulas, calculations, and charts.
Estimated observations
The Estimated column identifies observations that were not published by the provider but were estimated using the provider's recommended methodology.
Published observations are identified as:
No
Estimated observations are identified as:
Yes
This makes estimated-data status visible when working directly with the historical series.
Insert another copy
finPack does not overwrite a previously inserted CPI-history worksheet.
If you select Insert Series into Excel again, finPack creates another worksheet with a unique name.
This allows you to preserve an existing CPI table while inserting another copy or another CPI series.
Use the history in Excel
Once inserted, the CPI history can be used with standard Excel tools.
For example, you can:
- Filter the table by year or month.
- Create charts from the CPI values.
- Reference CPI observations in formulas.
- Compare historical periods.
- Identify estimated observations.
For formula-driven CPI retrieval without inserting a complete historical series, use FINPACK.CPI.
Related topics
FINPACK.CPI— Retrieve the individual CPI values used in a comparison.FINPACK.CPIINCREASE— Complete function reference.FINPACK.CPIAVGCHANGE— Complete function reference.- CPI Value — Detailed instructions for the task-pane feature.
- Calculate Annual CPI Increase — Compare the selected month with the same month one year earlier.
- Estimated CPI Observations — How finPack identifies estimated CPI data.
- CPI Data — Review the latest CPI Increase in the task pane.
- Compare Average CPI Periods — Compare consecutive average CPI periods instead of individual monthly observations.