CPI Average Change
The CPI Average Change section compares the average CPI over two consecutive periods of equal length.
Use this feature when you want to smooth monthly CPI fluctuations and compare average CPI levels over longer periods.
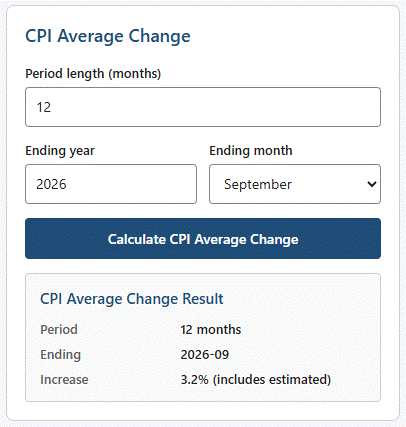
Calculate CPI Average Change
- Select a Country.
- Select a CPI Series.
- Enter the Period length in months.
- Enter the Ending year.
- Select the Ending month.
- Select Calculate CPI Average Change.
finPack calculates the average CPI for the period ending in the selected month and compares it with the immediately preceding period of the same length.
How the periods are determined
Suppose you select:
Period length   12 months
Ending          2026-09
The current period consists of:
October 2025 through September 2026
The preceding period consists of:
October 2024 through September 2025
finPack calculates the average CPI for each 12-month period and returns the percentage change between those two averages.
Conceptually:
Current-period average CPI
────────────────────────── - 1
Prior-period average CPI
Result
The result contains:
| Field | Description |
|---|---|
| Period | Number of months in each averaging period. |
| Ending | Final month of the current averaging period. |
| Increase | Percentage change between the two average CPI periods. |
For example:
Period    12 months
Ending    2026-09
Increase  2.6%
finPack displays the percentage change rounded to one decimal place.
Flexible period lengths
The period length is not limited to 12 months.
For example, a period length of:
3compares consecutive three-month average CPI periods.6compares consecutive six-month average CPI periods.12compares consecutive twelve-month average CPI periods.
Both periods must contain the required CPI observations for finPack to calculate the result.
CPI Average Change versus CPI Increase
CPI Average Change and CPI Increase measure different things.
CPI Increase compares the CPI for one month with the CPI for the same month one year earlier.
For example:
September 2026
compared with
September 2025
CPI Average Change compares average CPI values over two consecutive periods.
For a 12-month period ending in September 2026:
Average CPI from October 2025 through September 2026
compared with
Average CPI from October 2024 through September 2025
The commonly published 12-month CPI change is a same-month year-over-year comparison, not a comparison of 12-month averages. Statistics Canada describes the 12-month percentage change as a common CPI measure, and its published CPI information reports 12-month changes separately from annual-average measures. Statistics Canada CPI information
Estimated observations
When either averaging period contains one or more observations estimated using the provider's recommended methodology, finPack identifies the result as includes estimated.
For example:
Increase 3.2% (includes estimated)
No estimated indicator is displayed when both periods contain only published observations.
Using a worksheet function instead
The same calculation is available through FINPACK.CPIAVGCHANGE.
For example:
=FINPACK.CPIAVGCHANGE("ca","all-items",12,2026,9)
The function returns a numeric ratio.
For example, a result displayed by finPack as:
2.6%
is returned to Excel as:
0.026
Format the cell as a percentage to display the result as a percentage.
See FINPACK.CPIAVGCHANGE for complete syntax, arguments, examples, and error information.
Related topics
- CPI Data — Review the latest CPI value and CPI Increase.
- CPI Value — Retrieve CPI for a particular month and view the change from the previous month.
FINPACK.CPIINCREASE— Calculate the same-month annual CPI increase in a worksheet.FINPACK.CPIAVGCHANGE— Calculate CPI Average Change directly in Excel.